Huge numbers of walleye across a vast reservoir with dozens of lodges.
Free printable map (PDF) ↓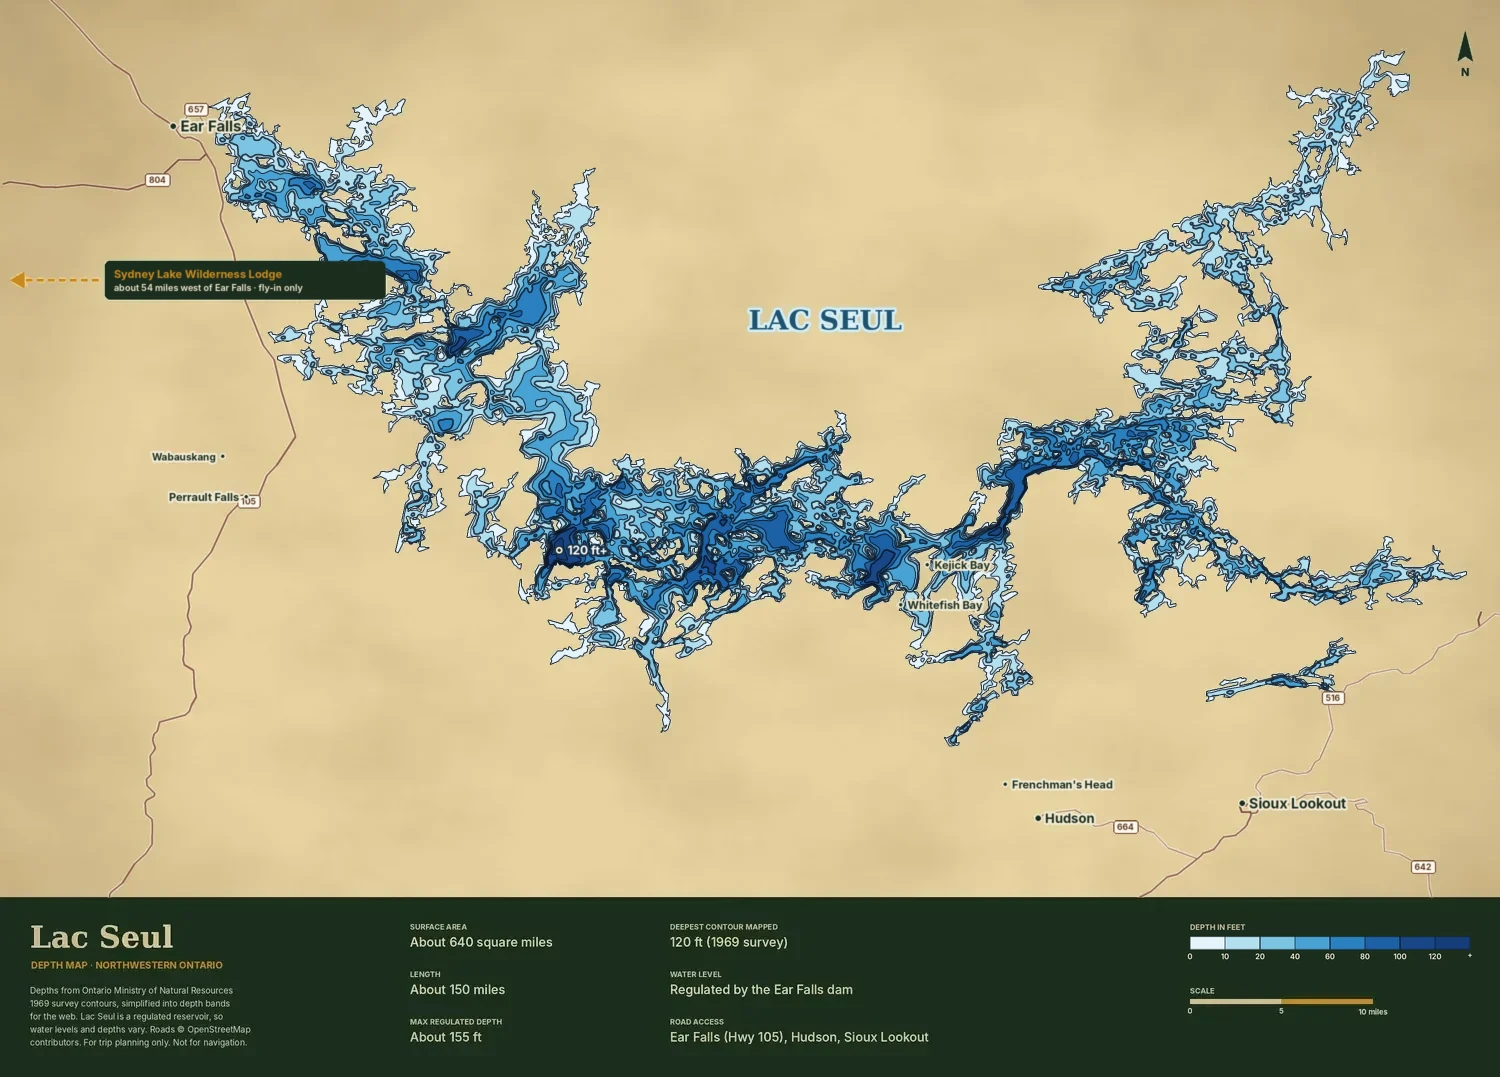 Download the free printable map (PDF) ↓
Draft map. Depth bands where a public survey exists; each map has its own scale bar.
Where: Northwestern Ontario · Ear Falls / Sioux Lookout
Size: about 409,000 acres (640 sq mi, hydro reservoir)
Access: Drive-to at Ear Falls, Sioux Lookout and Hudson; fly-in outposts on remote arms.
Deepest: 155 ft
Average depth: ?
Species to target: Walleye, northern pike, lake trout
Walleye limit (US angler): 4; none 46–53 cm, 1 over 53 cm
Typical ice-out: ?
Who else is on the water: dozens of lodges and outposts
Size (acres)
Sydney & Kilburn: about 17,570 (Sydney 14,240 with the Sturgeon River + Kilburn 3,330)
Lac Seul: about 409,000 (640 sq mi, hydro reservoir)
Boats on an average summer day
Sydney & Kilburn: 10 ✓
Lac Seul: 339
Acres per boat
Sydney & Kilburn: 1,760 ✓
Lac Seul: 1,210
Rough-water days a season
Sydney & Kilburn: 1.7 (Kilburn 0) ✓
Lac Seul: 8.4
Sheltered water
Sydney & Kilburn: 75% ✓
Lac Seul: 60%
Walleye a US angler may keep each day
Sydney & Kilburn: 2, both 18 in or under ✓
Lac Seul: 4; none 46–53 cm, 1 over 53 cm
Clearest summer water
Sydney & Kilburn: 26 ft
Lac Seul: ?
Deepest spot
Sydney & Kilburn: 240 ft (Kilburn 213 ft) ✓
Lac Seul: 155 ft
Cisco (tullibee)
Sydney & Kilburn: ●
Lac Seul: ●
Whitefish
Sydney & Kilburn: ●
Lac Seul: ●
Free of invasive smelt
Sydney & Kilburn: ● ✓
Lac Seul: –
Mayfly mud flats
Sydney & Kilburn: ●
Lac Seul: ●
Disturbances on or upstream (of 6)
Sydney & Kilburn: 0 ✓
Lac Seul: 5
Typical ice-out
Sydney & Kilburn: about May 5
Lac Seul: ?
Hours from Minneapolis
Sydney & Kilburn: 7 h drive + 0.5 h flight ✓
Lac Seul: 8.5 h drive
Who else is on the water
Sydney & Kilburn: 1 lodge, 0 cottages
Lac Seul: dozens of lodges and outposts
✓ marks the better value. ? means we couldn’t find accurate data or a close estimate. We’ve made every effort to be accurate, but some figures are estimates and there may be errors or gaps. How we measured